Project Overview

Track task and project statuses, hours worked per project, and more.

Project Overview Dashboard - Smart Dashboard

This Asana project dashboard provides an overview of a team’s projects and tasks. With this IT operations dashboard, we can answer the following questions:

  • Firstly, how many projects are in progress? Also, how much time have we spent on each project?
  • Secondly, what are our task statuses?
  • Thirdly, how many incomplete tasks does each team member have?
  • Finally, which projects have the most incomplete and overdue tasks?

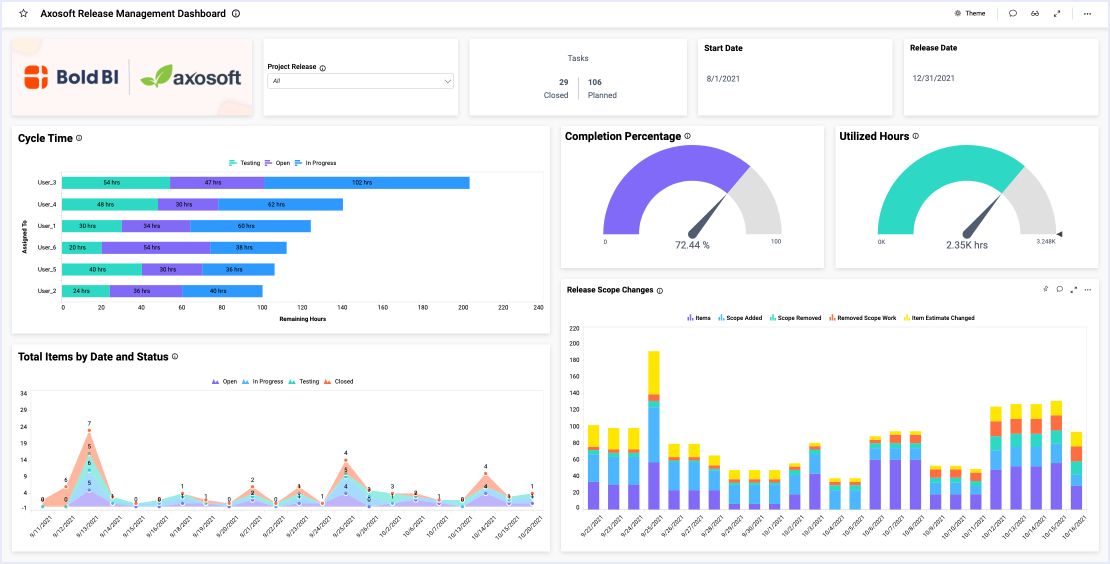
Track Task Statuses and Project Details

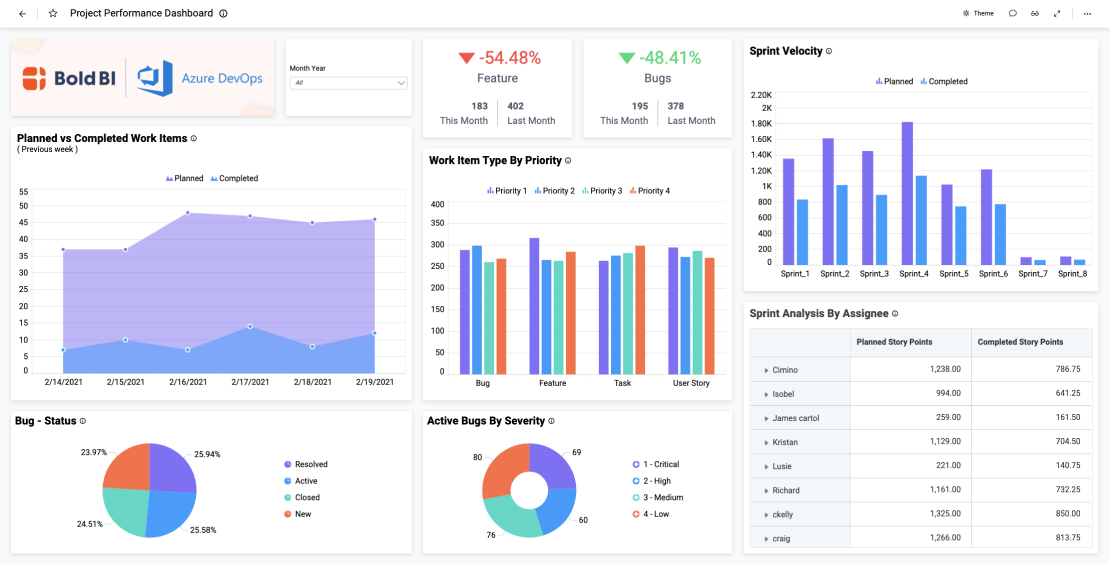
With the card widgets at the top of the dashboard, project leaders can quickly see the total number of projects, task completion rate, and number of outstanding and overdue tasks. Then, viewers can see each project’s planned and completed tasks, along with the number of tasks per project, in the bar graphs below the cards. Further, the task completion status doughnut chart shows the percentage of complete, incomplete, and overdue tasks.

The “Incomplete Tasks by Assignee” and “Incomplete and Overdue Tasks by Project” graphs provide further insight into the details surrounding outstanding tasks. 

The planned vs completed tasks spline chart could help leaders identify trends that may occur over time and track seasonal changes in the team’s workload. Similarly, the estimated vs actual hours bar graph could help leaders assess the accuracy of their project time estimates.

Finally, the task summary grid lists each task’s associated project, assignee, type, status, and due date.
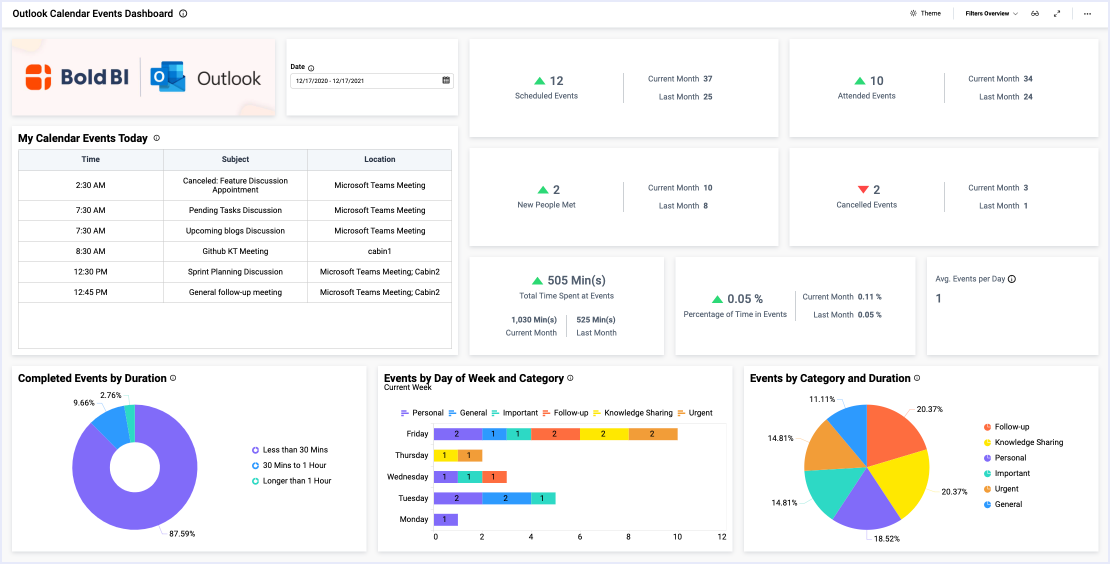
Filter Your Data 

It is also worth noting that this dashboard offers three filtering options. Viewers can filter data by project, date, or assignee. This feature is useful for leaders who want to focus their analysis on a specific set of data.

Access live 30-minute demo with our experts

Information Technology Dashboard Examples

IT Tickets Management Dashboard

This customer service performance dashboard provides a detailed breakdown of an IT team’s operations. With this dashboard…

IT Dashboard

Smart Dashboard’s project management dashboard outlines the financial health of an IT company. Further, it displays detailed…

Project Performance Dashboard

This project performance dashboard provides an overview of an IT team’s sprint tasks. With this Azure DevOps dashboard…

Issue Tracker Dashboard

This issue tracker dashboard provides a detailed overview of a team’s created and closed issues. With this dashboard, we can answer…

Forum Management Dashboard

This forum management dashboard allows moderators to track key metrics relating to threads and forums. With this dashboard, we can answer…

Axosoft Project Release Management Dashboard

This Axosoft release management dashboard allows product managers to track key product release metrics.

Outlook Calendar Events Dashboard

This Outlook calendar events dashboard helps team members optimize their daily activities. With this dashboard, we can answer…

We'll help you find the best solution for you

Up arrow icon
Live Chat Icon For mobile
Hugo Morris

Chat with the Smart Dashboard Sales team now!

Live Chat Icon