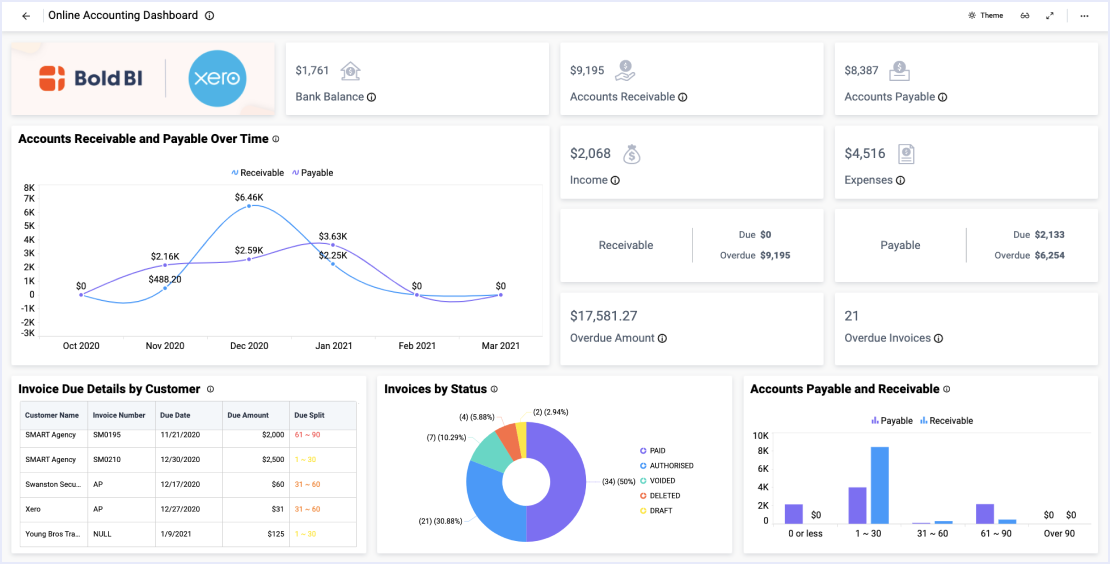


- Firstly, what are our AR and AP numbers?
- Secondly, what do these numbers look like when organized by payment due date?
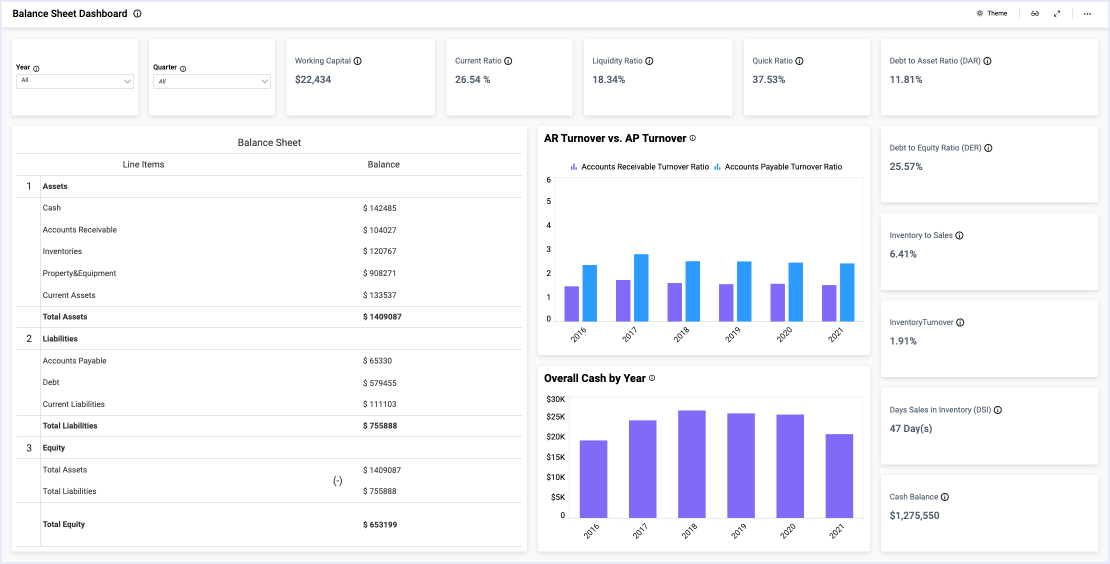
- Next, how does our net working capital compare to our gross working capital?
- Finally, what are the crucial figures from our balance sheet? For example, what is our current ratio, equity ratio, and debt-to-equity ratio?
Analyze Accounts Payable and Accounts Receivable
Firstly, with the “Total AR” and “Total AP” widgets, users can see a summary of how much is owed to the company versus how much the company owes. These numbers are organized by due date in the “Total AR Aging” and “Total AP Aging” bar charts. Further, these charts could be used to help the company ensure that they allocate resources appropriately. For example, the AR Aging widget could help the company determine where AR resources should be assigned in order to increase the chances of obtaining payment from customers.
Next, the DSO and DPO widgets display more information about the company’s AR and AP health. The DPO widget could also provide insight into the credit terms the company receives from its vendors (and how their credit terms compare to others’).
Track Key Balance Sheet Figures
Finally, the “Current Ratio,” “Equity Ratio,” “Debt Equity,” and net working capital widgets outline the company’s key big-picture financial metrics. These figures provide insight into assets and liabilities, offering a more complete picture for a CEO or CIO than could be expressed by revenue numbers alone.
This dashboard’s information is crucial because it displays an easy, up-to-date visual reference for reviewing complex—and constantly changing—numbers. With this data, users can quickly analyze the company’s critical financial metrics and assess its long-term health.