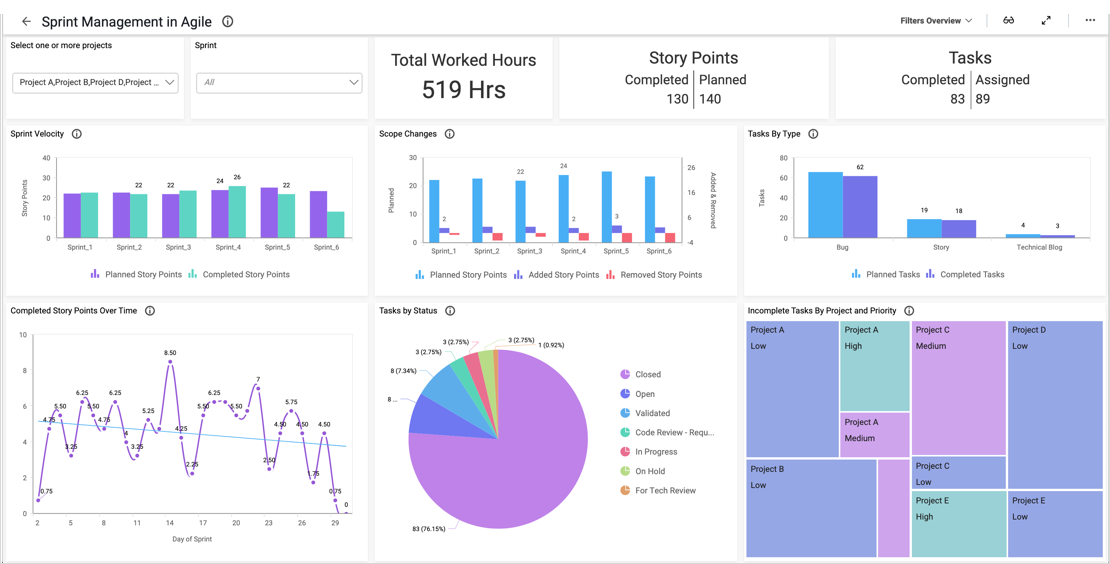


- What is our overall task completion rate?
- How many bugs and features are closed?
- How do our tasks break down by status?
- Finally, how many of our planned work hours have we utilized?
Track Team Performance and Task Statuses
With the card widgets at the top of the dashboard, we can easily track the team’s total resources, overall task completion rate, and features and bugs closed. Then, we can review the column and doughnut charts below the cards to gain additional insight into the team’s progress.
First, the bar chart outlines the percentages of completed versus planned tasks for each project, offering a visual representation of how close the team is to completing each project. Next, the “Tasks by Status” doughnut chart provides a breakdown of the percentage of tasks in each status.
With the work hours radial gauge and bar chart, leaders can track the total number of hours worked by the entire team and by individual team members in comparison to the number of hours planned for the projects. This information is crucial as it offers key insight into the team’s performance and into the number of hours it takes each team member to complete their tasks. Moreover, tracking this data over time can help the team improve its project planning. Also, the “Tasks Summary by Resource” grid displays each team member’s number of planned and completed tasks.
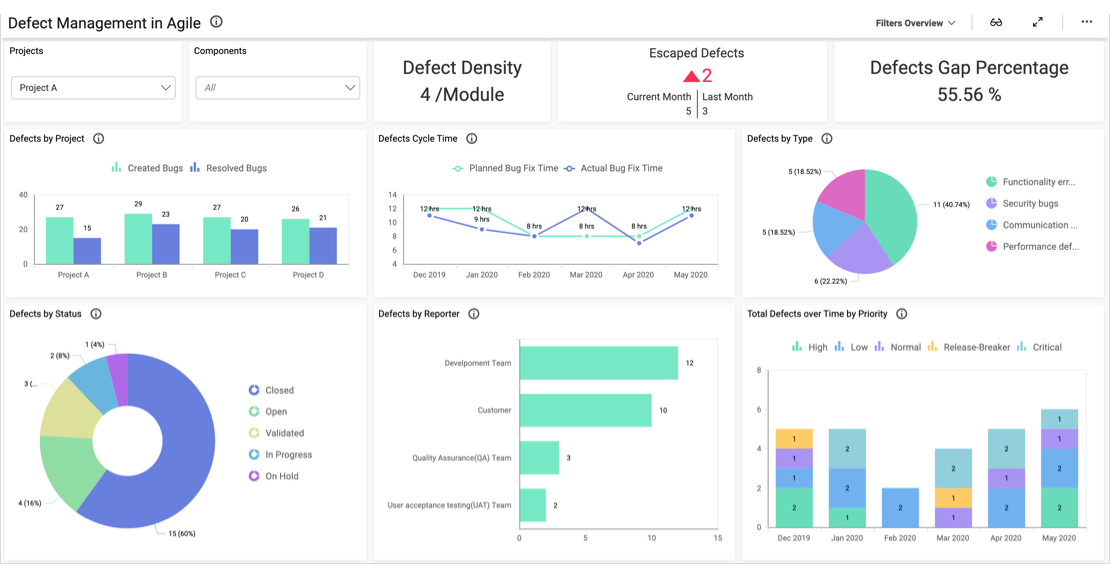
Finally, the stacked bar chart in the lower right corner of the dashboard organizes bugs by status and priority, allowing the team to quickly identify the number of critical and high priority bugs in each status.
Filter Your Data
One key feature of this employee performance dashboard is its versatility. With the “Project” filter, viewers can display data for any single project or combination of projects. Users can reset the filter by clicking the funnel-shaped icon in the upper right corner of the list box. This feature is invaluable for users who need to focus their analysis on specific pieces of data.